Introduction
For some time now, ShinyProxy is able to export metrics using Prometheus. After releasing this feature, we provided a dashboard for Grafana to visualize these metrics. Although this provides a good basis to build a monitoring setup around ShinyProxy, it does not provide insights in logs or resource usage of individual apps. To fill this gap, we are publishing a GitHub repository containing a comprehensive monitoring set up for ShinyProxy on Kubernetes. The repository contains all Kubernetes manifests required to set up and integrate Prometheus, Loki and Grafana.
Dashboards
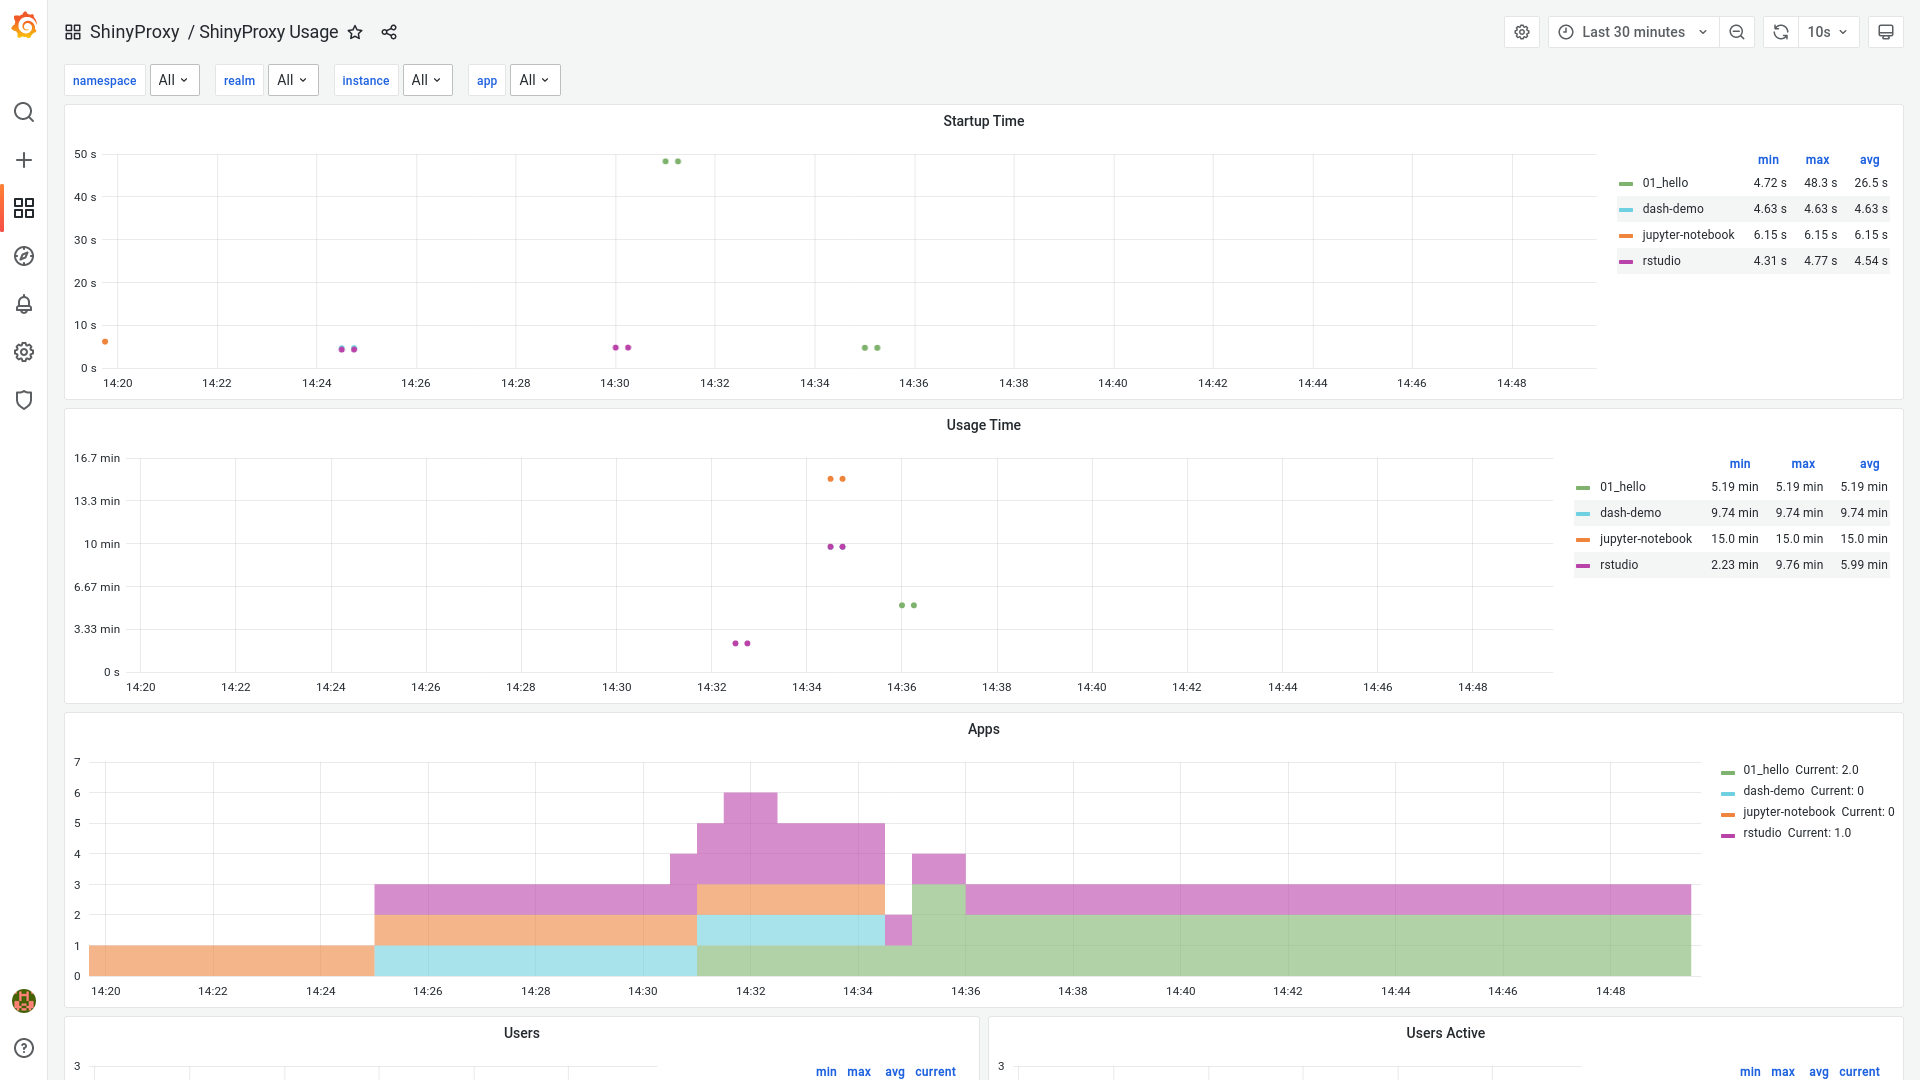
The stack allows you to view
- the ShinyProxy usage (both real-time and aggregated over a long period),
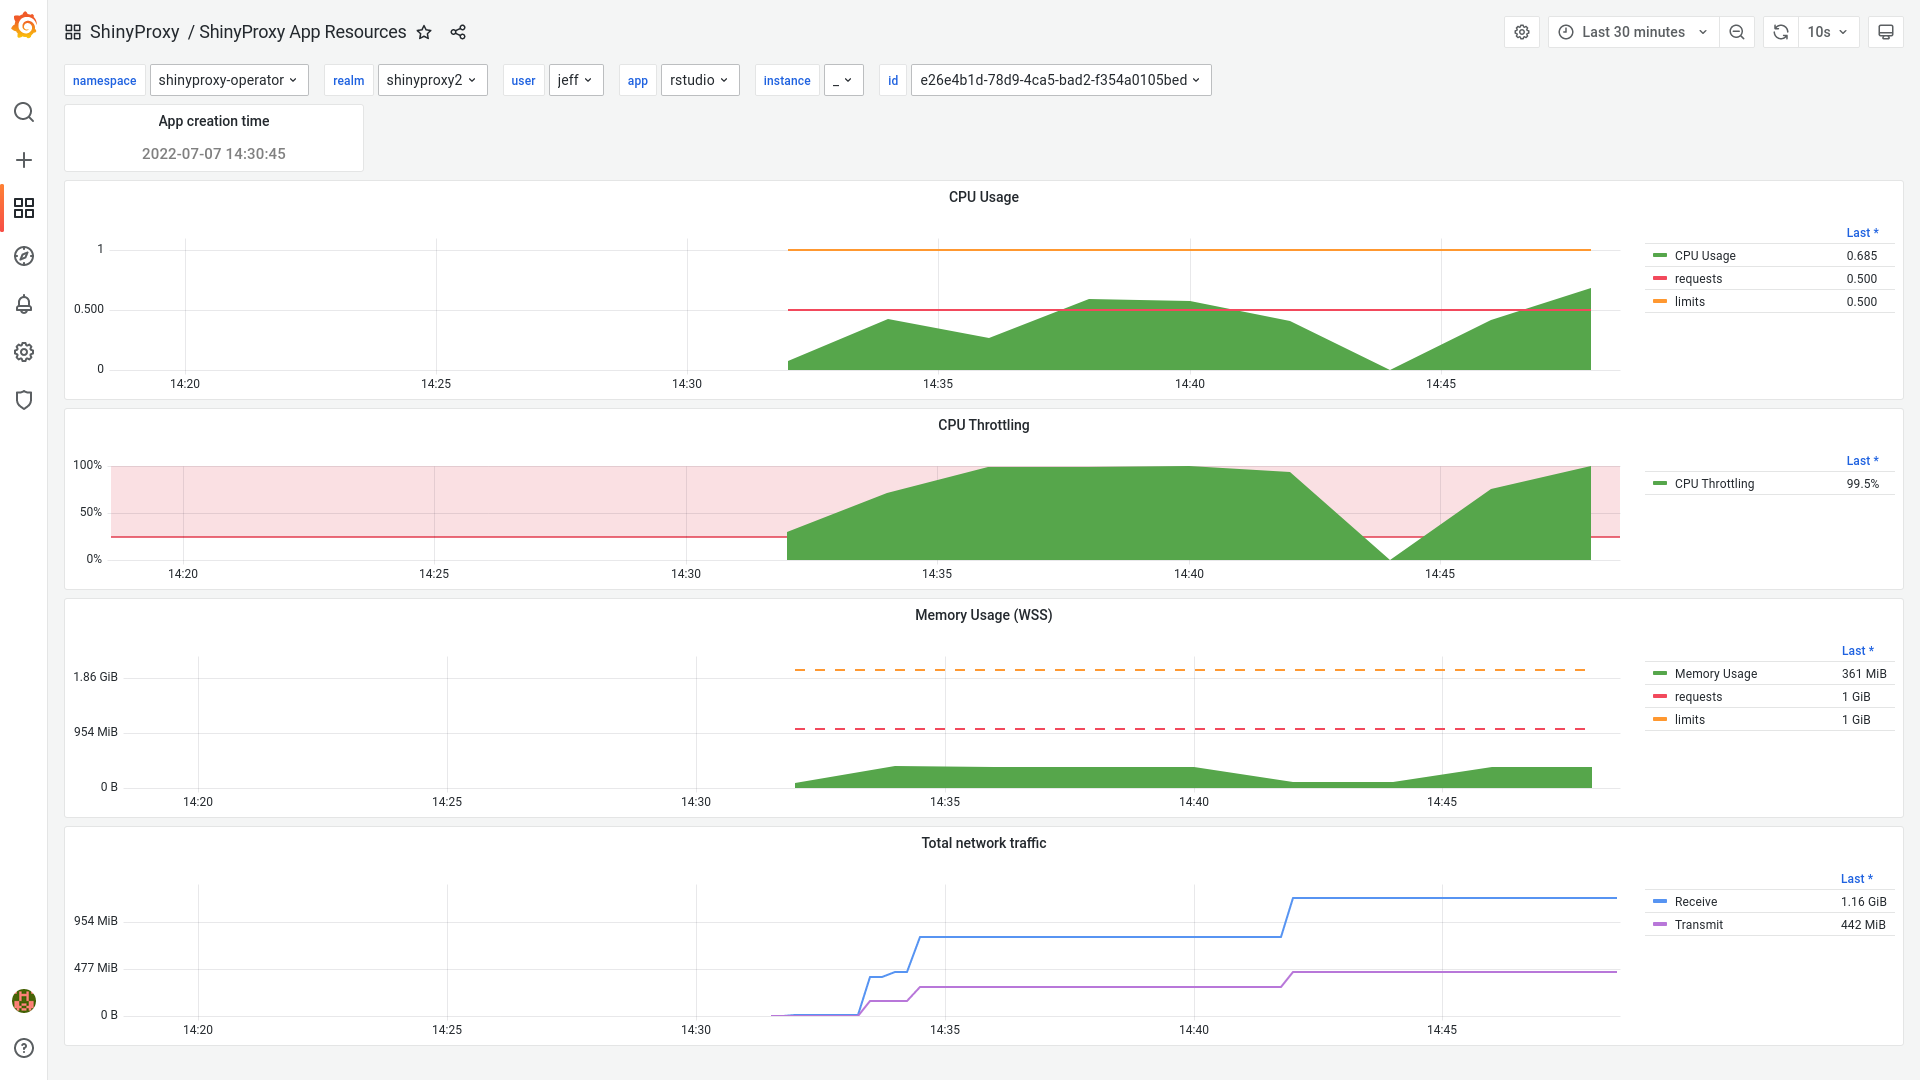
- the resources (CPU, memory …) used by apps and
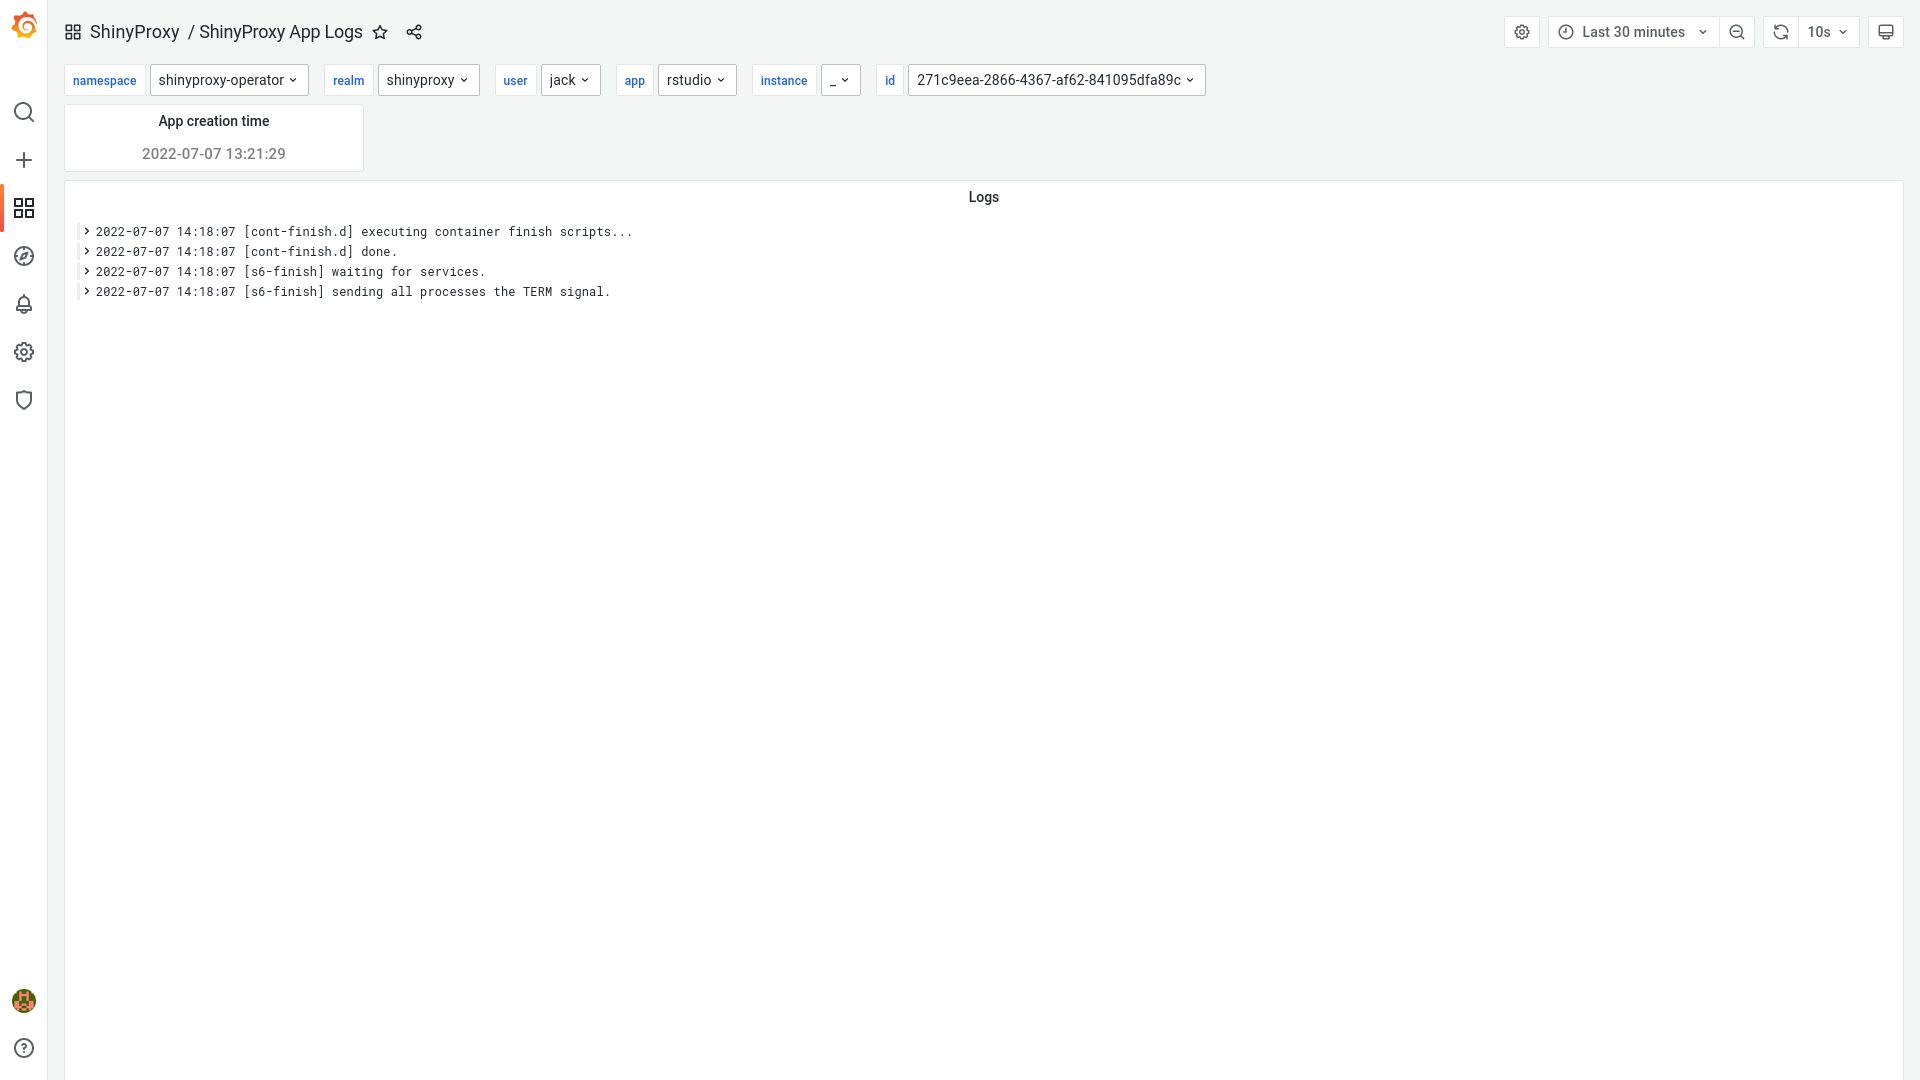
- the logs of
- ShinyProxy,
- the ShinyProxy Operator and
- the apps hosted by ShinyProxy.
We fine-tuned the six Grafana dashboards to be fast, even if retrieving data for a long period and a large amount of apps.
Check out the repository for the complete explanation. We are looking forward to any feedback on the issue tracker of the repository. Have fun!